Dashboard
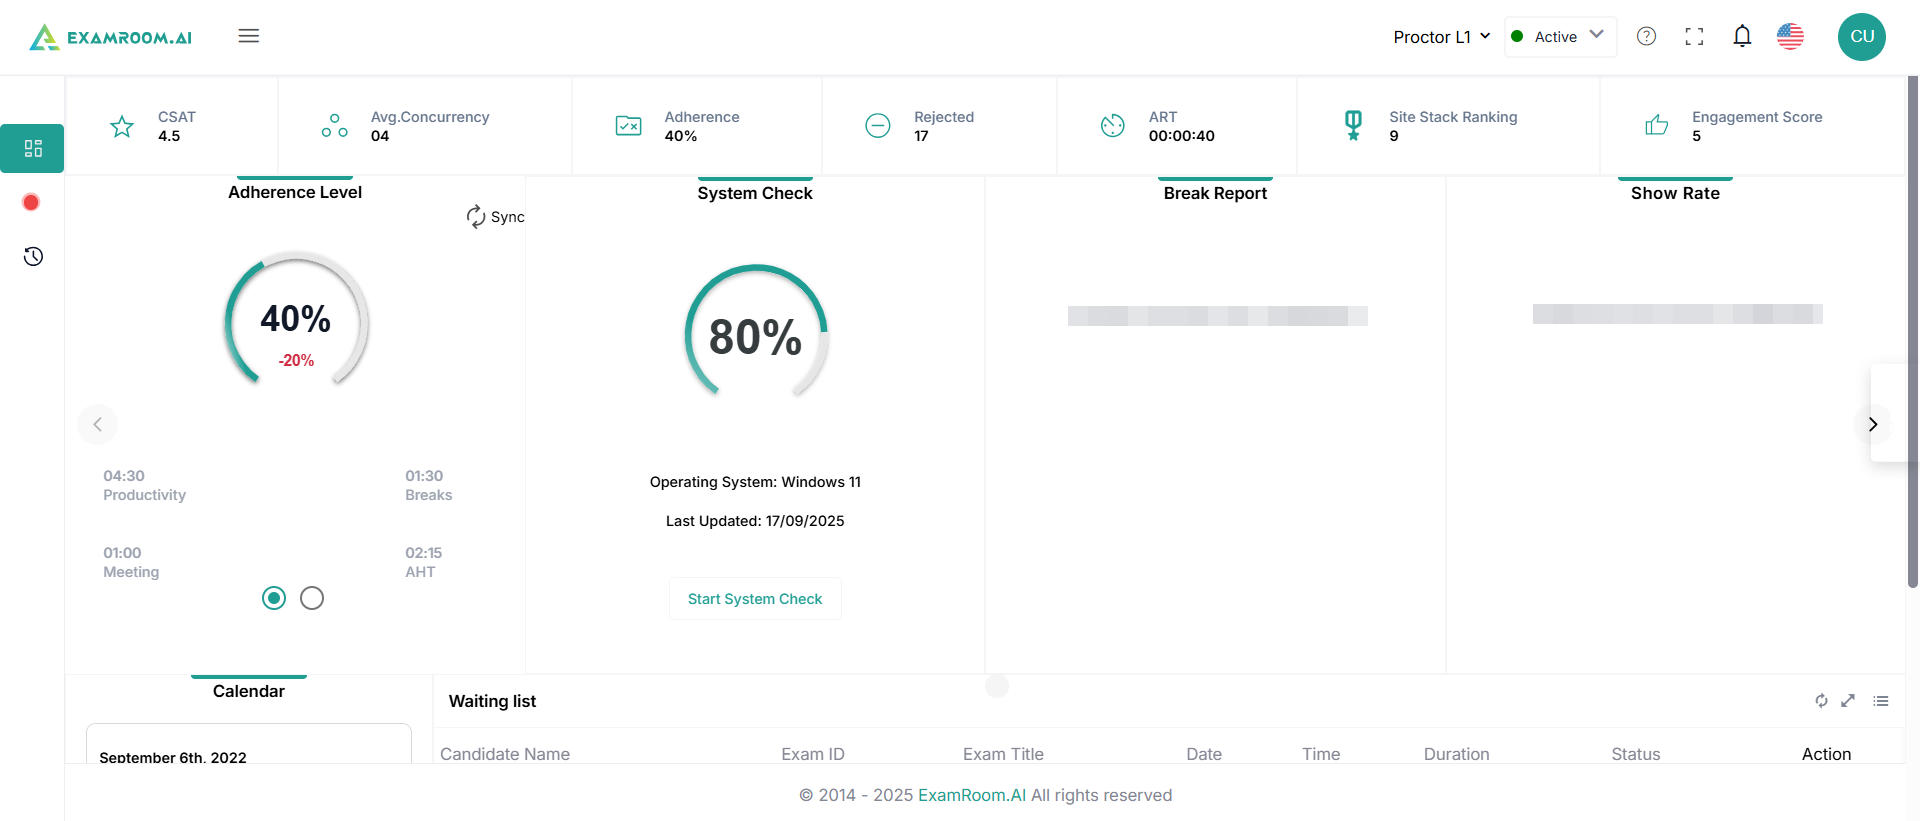
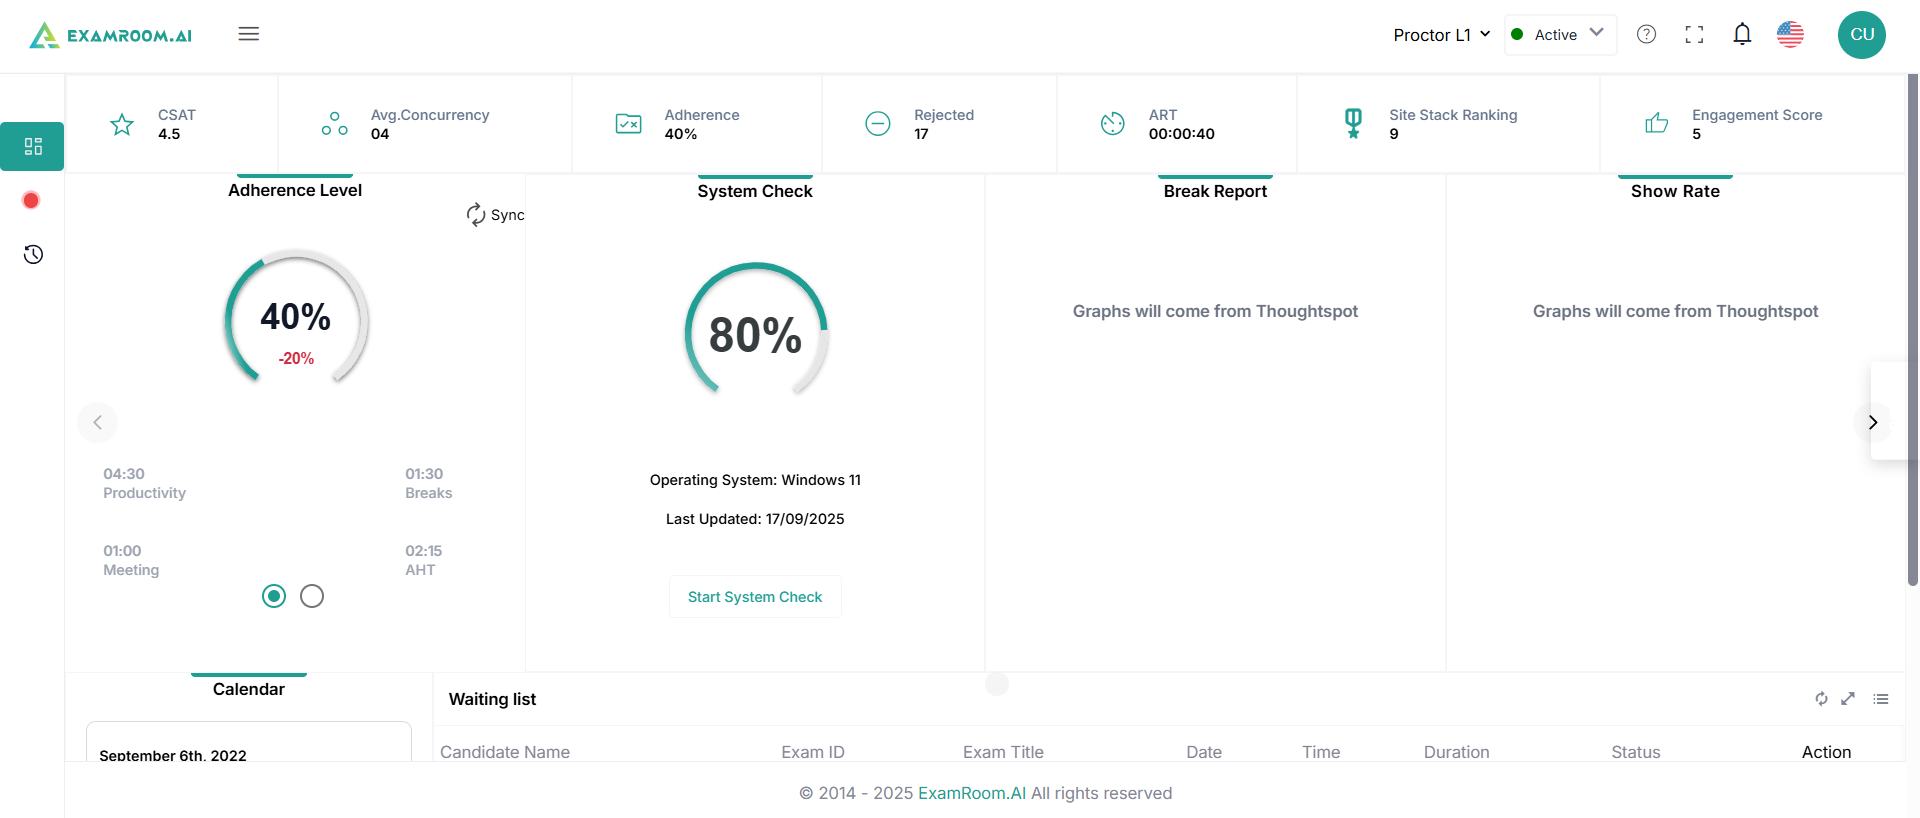
- The dashboard is a landing page with the following information:
- The fields in the toolbar located at the top of the dashboard correspond to the application administration with icons and descriptions described in the table below.
| Icon | Type | Description |
 | Role | Click to switch role among OBA, proctor L1, and operations manager |
 | Status of OBA | Click to change the Status |
 | Zen Mode | Click to access full-screen, and block distractions |
 | Notifications | Click to provide alerts, reminders, updates |
 | Languages | Switch between other languages, tailoring the console experience to their language preference |
 | Profile | It enables efficient account management, with options to edit personal information, access help resources, and securely log out. |
- The top panel has the following information for users to view:
- CSAT: Measured based on feedback and ratings given by the candidates after completion of each proctoring session in the current financial year.
- Adherence: The percentage of adherence is calculated by considering a few performance parameters like calls handled, AHT, available time, etc.
- Rejected: This shows the count of candidates rejected following their assignment by the roster. When an assigned candidate is rejected, the count increases by one.
- ART: The average response time is the amount of time taken to receive the candidate and respond to an issue raised by the candidate. This count will be based on all the proctoring sessions that have been completed in the current financial year.
- Site Stack Ranking: Measured by considering a few parameters like attendance, AHT, and FCR to find the information that shows overall performance and ranks it (top to bottom).
- Engagement Score: Calculated based on the engagement that you are showing during the proctoring session by responding to the on-screen game, the system will trigger if your screen is not active for more than 30 seconds. When the system triggers the game, you should respond to it by taking the necessary actions. The more actions at the right time, the higher the engagement score, and vice versa.
- The main screen has the following information to view:
- Adherence Level: This widget is dedicated to showing the adherence percentage, including the time count of adherence or productivity, breaks, meetings, and AHT in minutes, and change percentage.
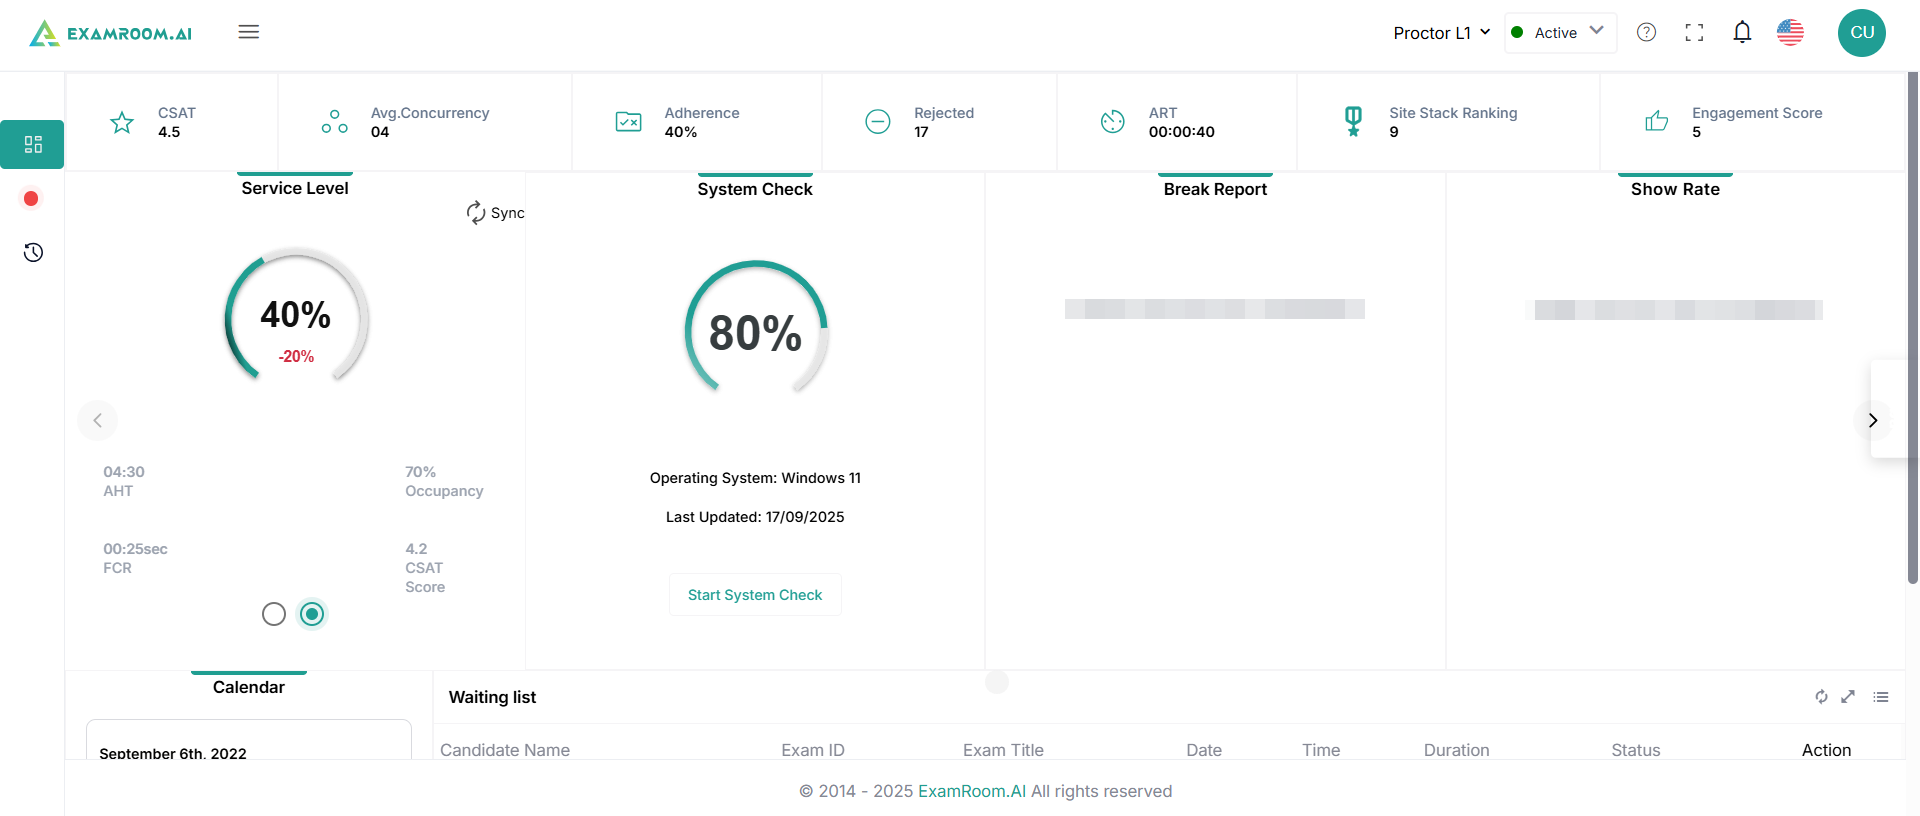
- Service Level: A standard metric to determine the quality of service provided to the candidates. This is based on AHT, occupancy, and the calls offered or abandoned. This widget shows the service percentage, including the AHT, occupancy, CSAT score, FCR time, and CSAT score.
- Break Report: Displays information about the breaks you have taken during working hours. When you take a break, you must choose the break option from the drop-down menu of status, available on the top right toolbar of the proctor console. Whenever you choose a break, the system starts counting the break time, which is reflected in the graph.
- Show Rate: A calculated percentage value by referring to your attendance during the month.
- Leaderboard: List of the best performing proctors in the organization.
- Calendar: Displays your scheduled events for the day. This calendar view is in sync with the Microsoft (Teams and Outlook) calendar.
- Waiting List: Shows the list of candidates assigned to you. You have the option to either accept or reject a candidate. This list contains brief information about the candidates who are assigned. The following figure shows the candidate’s details:
- Candidate Name: Name of the candidate
- Exam ID: Unique ID of the exam
- Exam Title: Name of the exam
- Date: Date of commencement of the exam
- Time: Scheduled time of the exam
- Status: Status of the candidate
- Action: Actions that can be taken on the candidate. i.e., Accept or Reject.